Looker Studio - when my users purchase - free e-commerce report
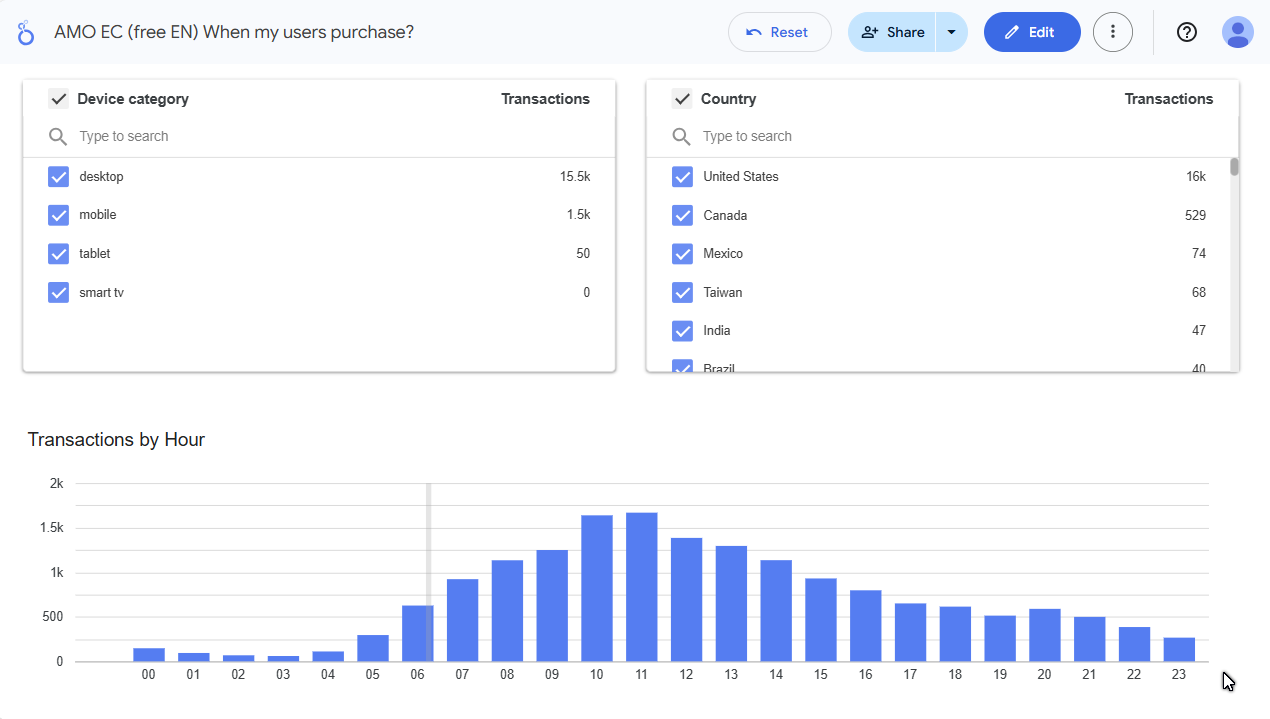
This report helps you understand your customers’ purchasing habits. It shows which days of the week and hours users most often complete transactions in your store.
The report is available for free
Open report:
➜ View report in Looker Studio
➜ View report in Looker Studio
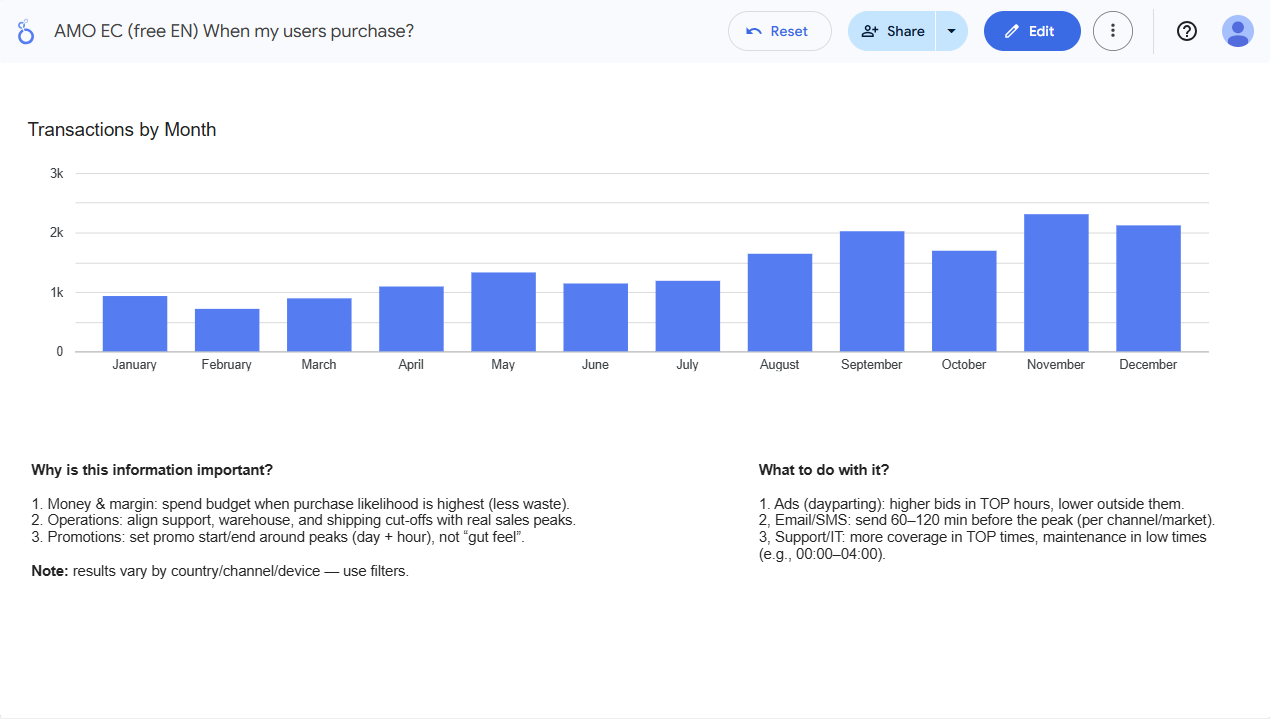
Why is this information important?
- Allows for more precise ad campaign planning (bid adjustment).
- Helps choose the best time for sending newsletters and push notifications.
- Facilitates planning customer service staffing during peak hours.
- Identify “dead hours” suitable for technical maintenance.
What to “take away” from this report?
Specific conclusions for budget and schedule optimization:
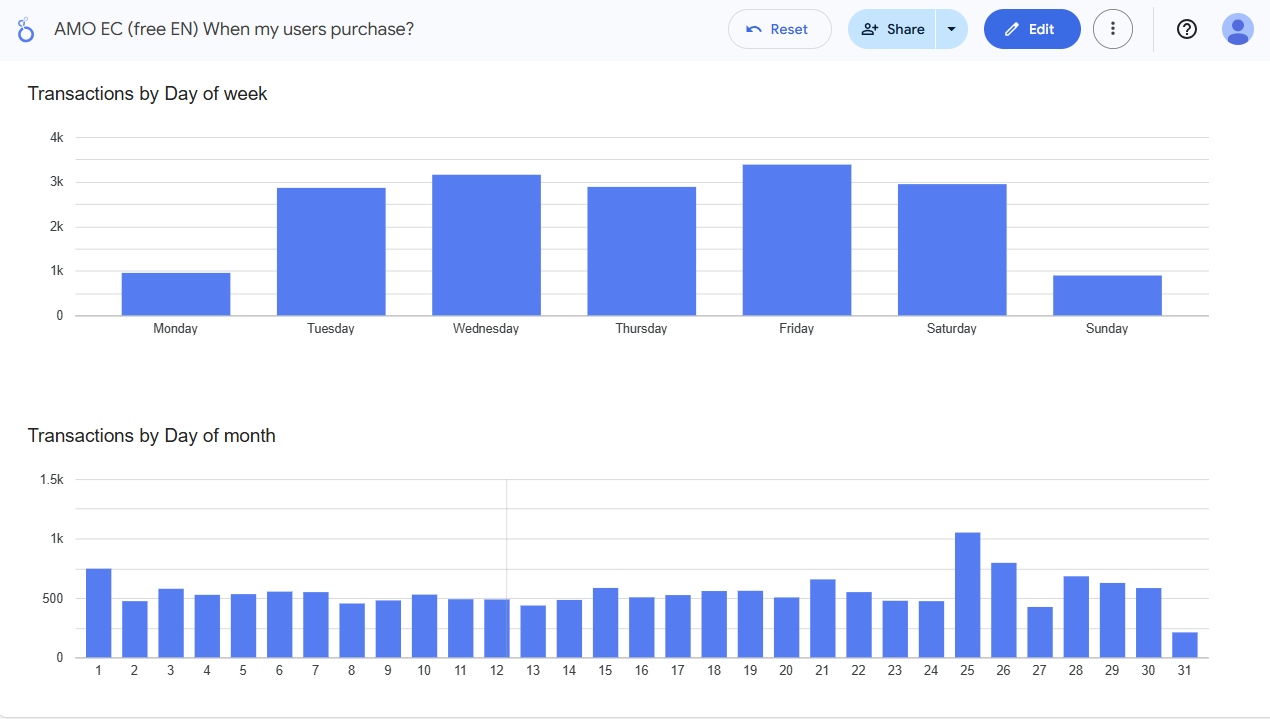
- Days and hours with the highest conversion rate.
- Times of day when users are just browsing vs. when they actually purchase.
Why won’t a marketer do this for you?
They will - if you ask. However, actions are often based on general market trends, and every industry and store has its own specifics. Your customers might purchase at completely different times than the market average.
How to use the report?
Open the report
from the link above.Log in to your Google account
(this is normal in Looker Studio).Select your GA4 account
and data source (if the report asks to connect).Click the bars - they work as filters
Cross-filtering in Looker works great hereIf a permissions message appears: ensure you have access to GA4 at least at the Analyst / Viewer level.
Want a similar report tailored to your store?
Report Metadata
- Report Version: v1.0
- Last Update: 2026-02-16
- Requirements: GA4 access + Google account
- Data Source: GA4